GraRLS - Graphics Programming Language
Examples
This page contains a number of real-world examples.
Charts
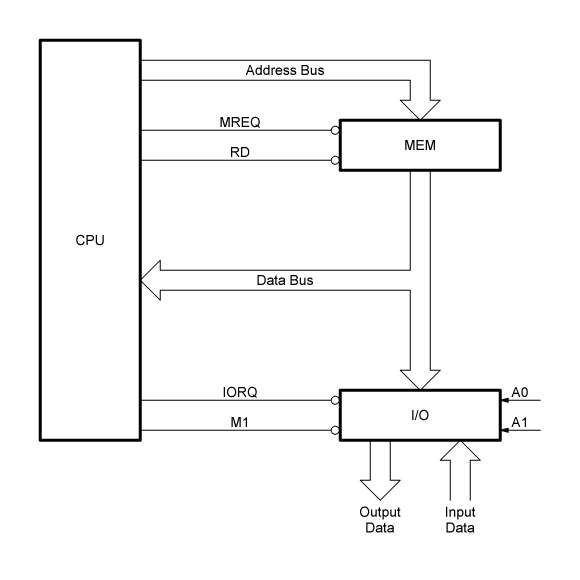
Diagrams
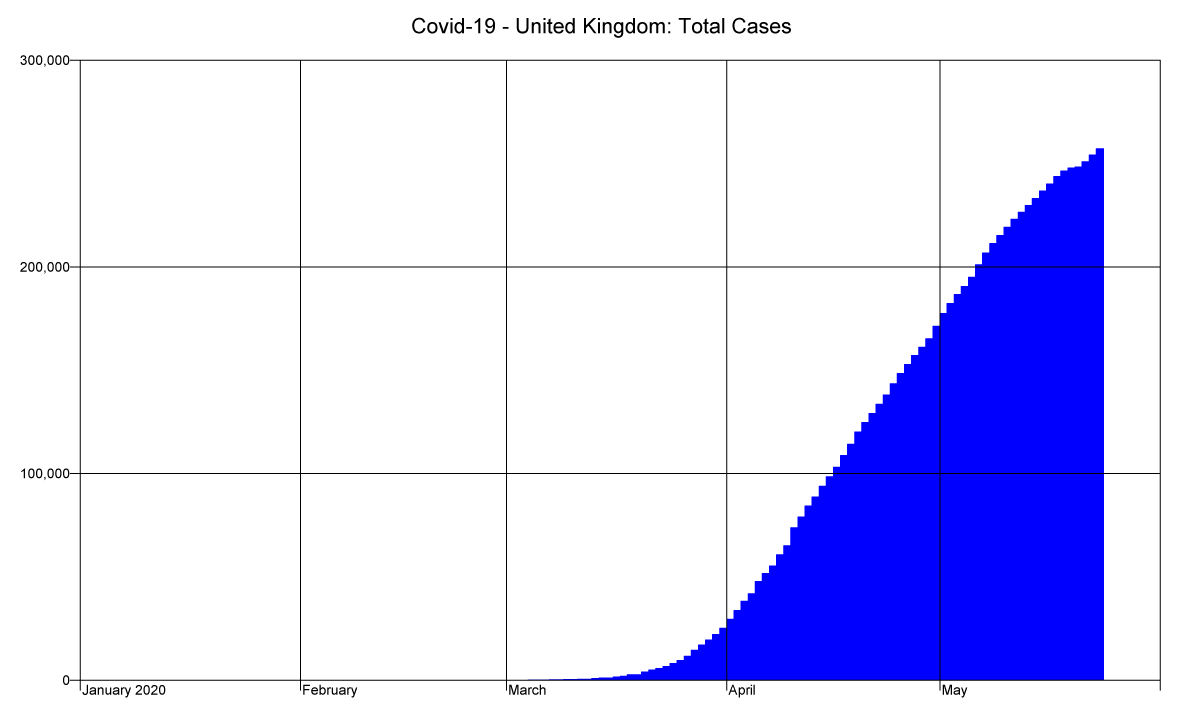
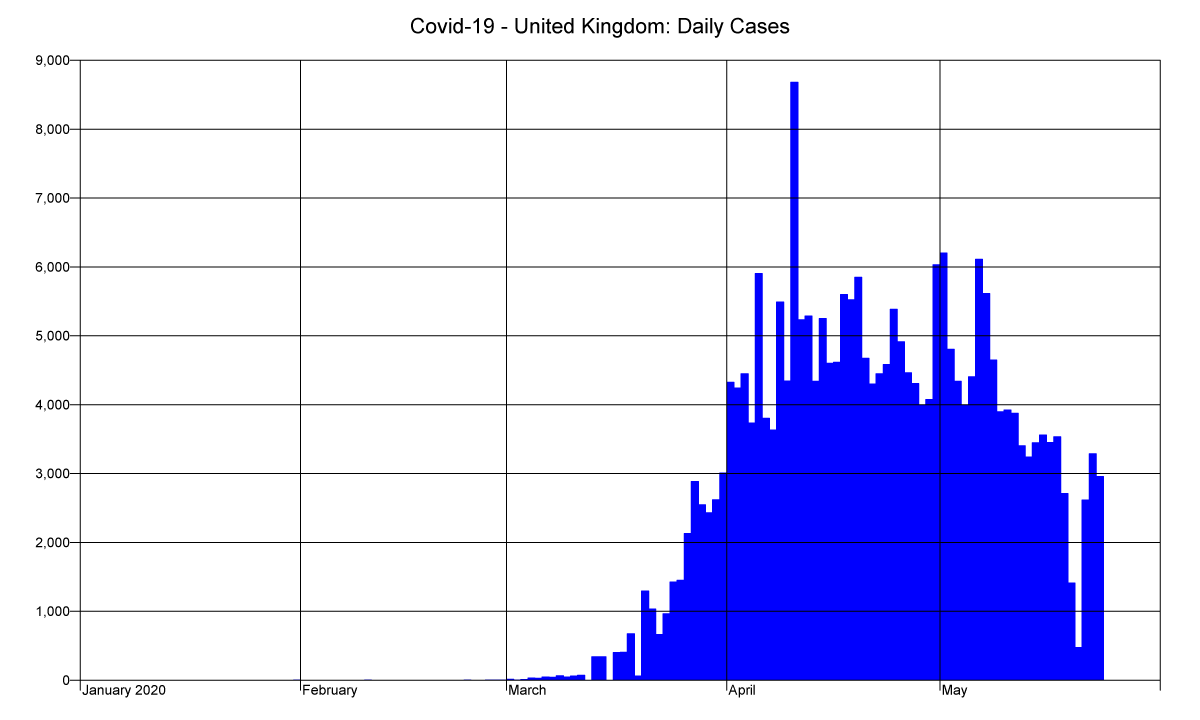
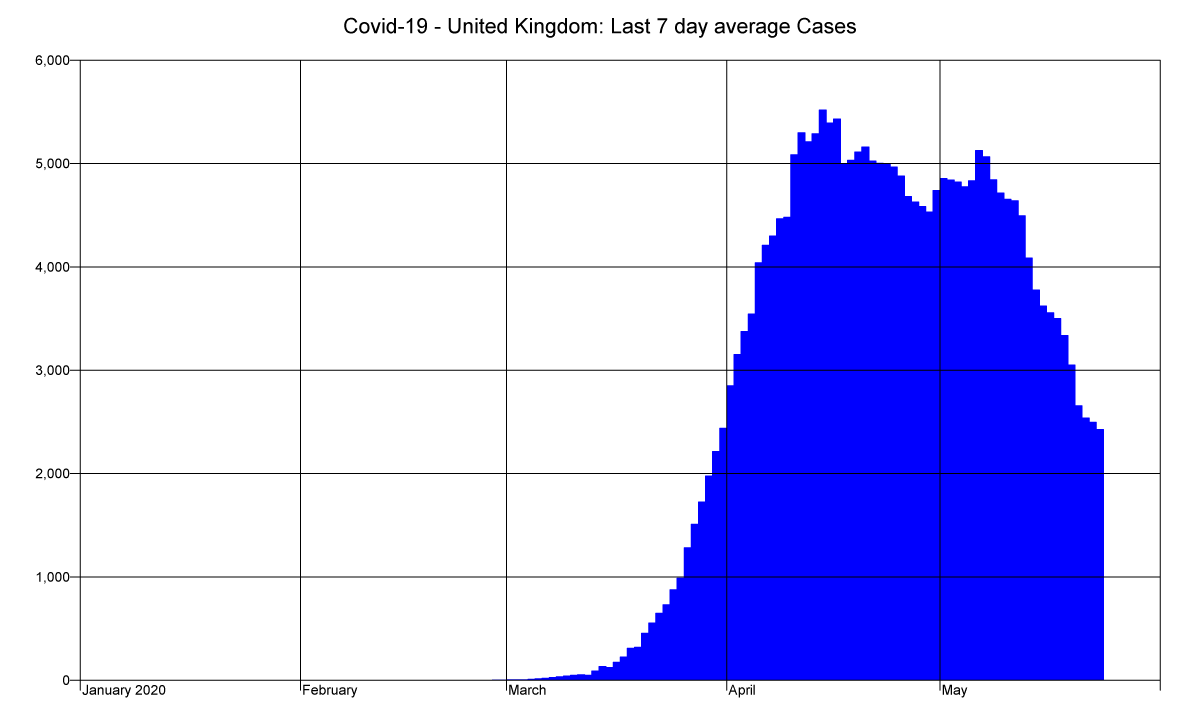
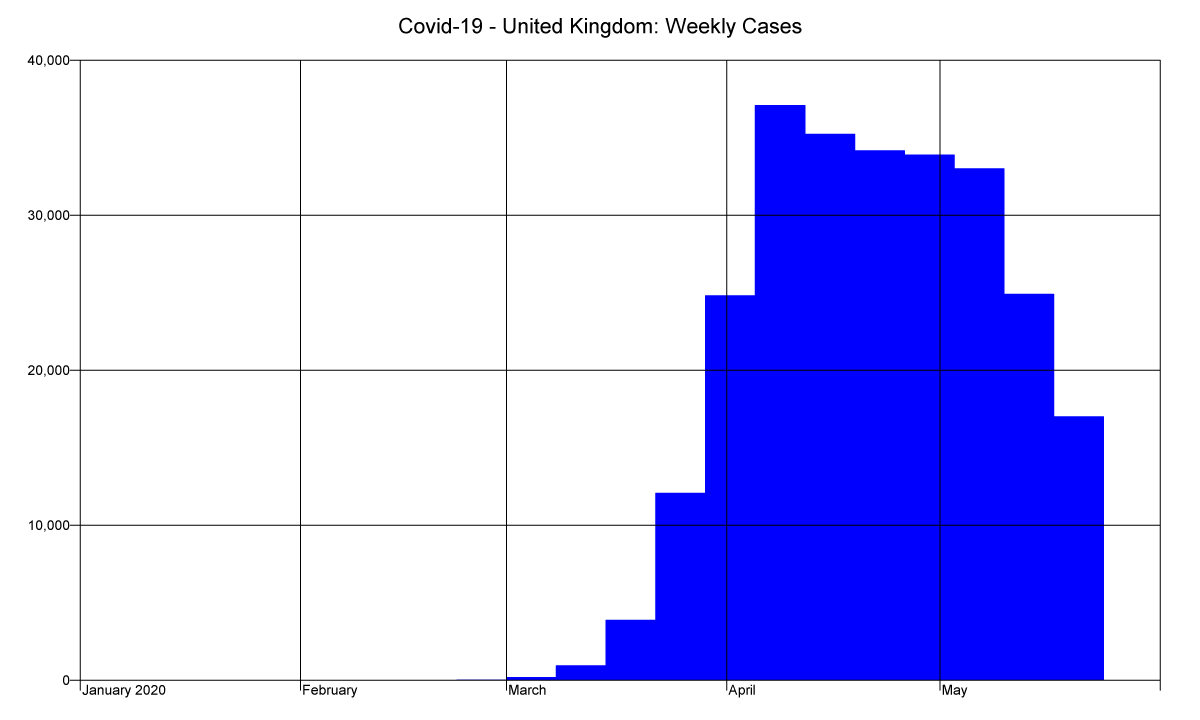
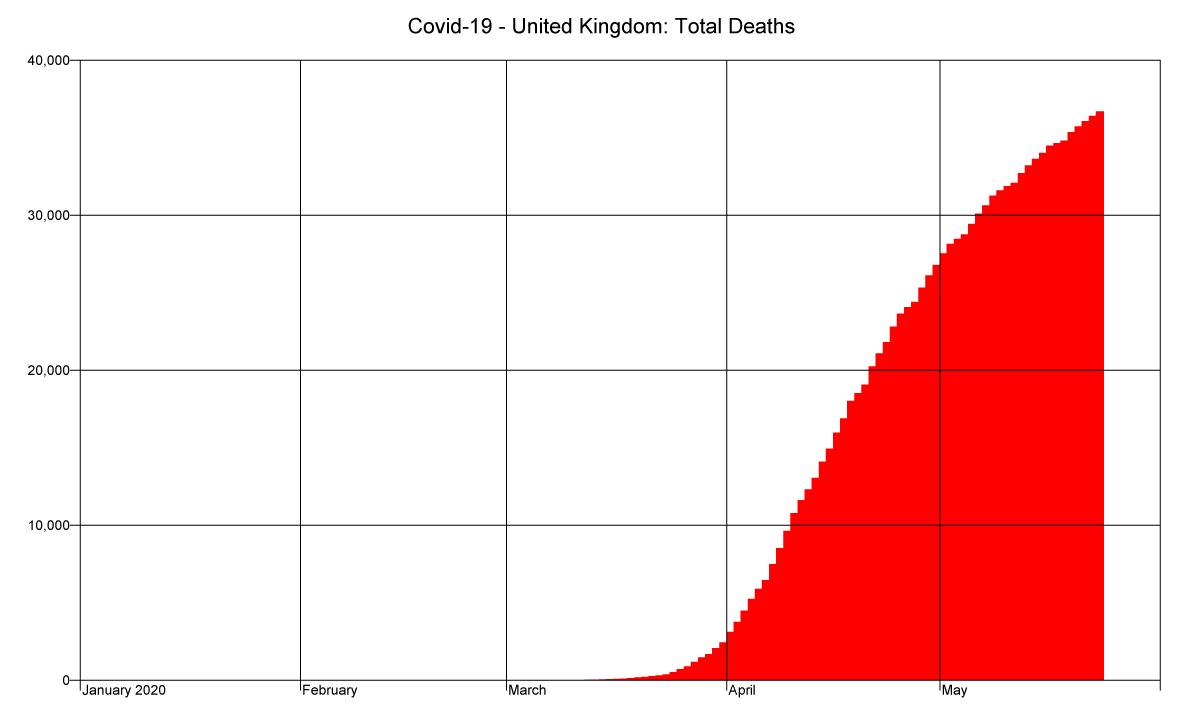
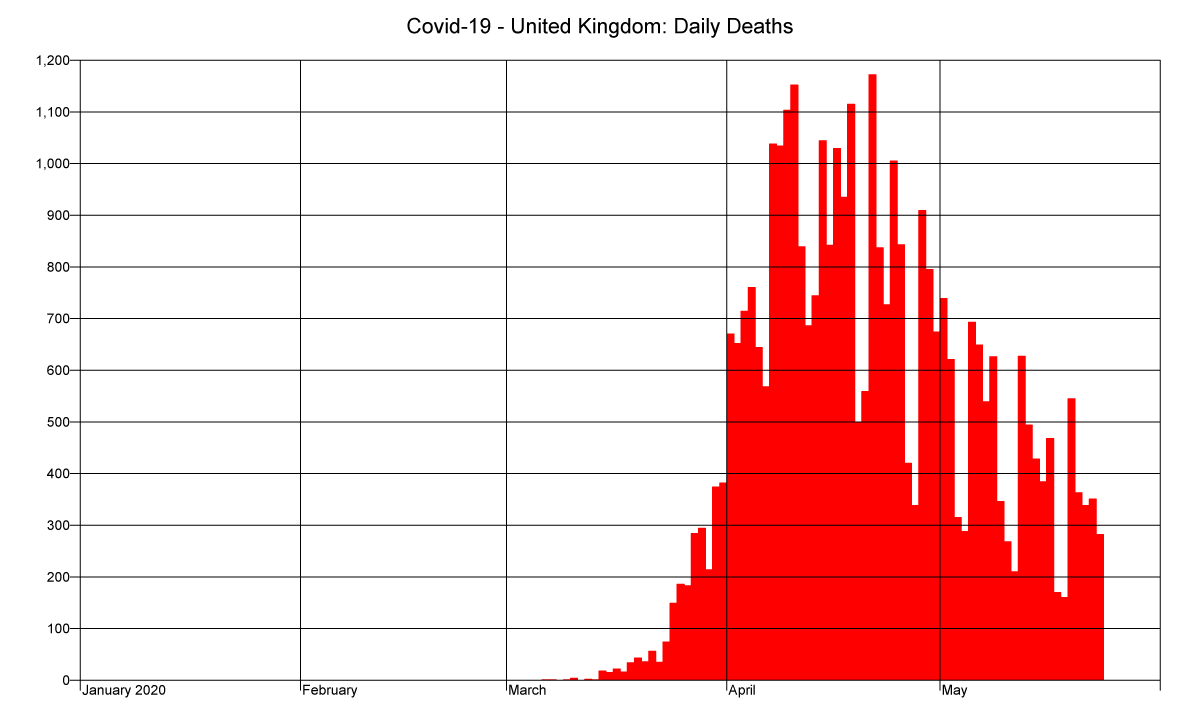
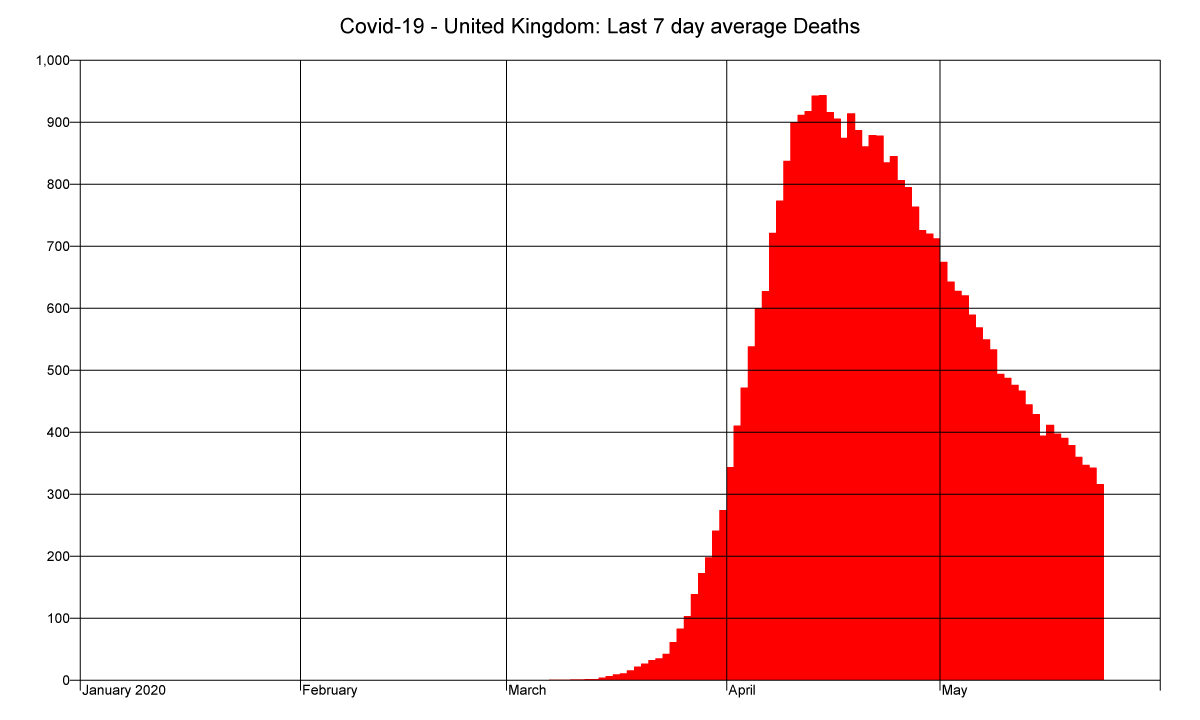
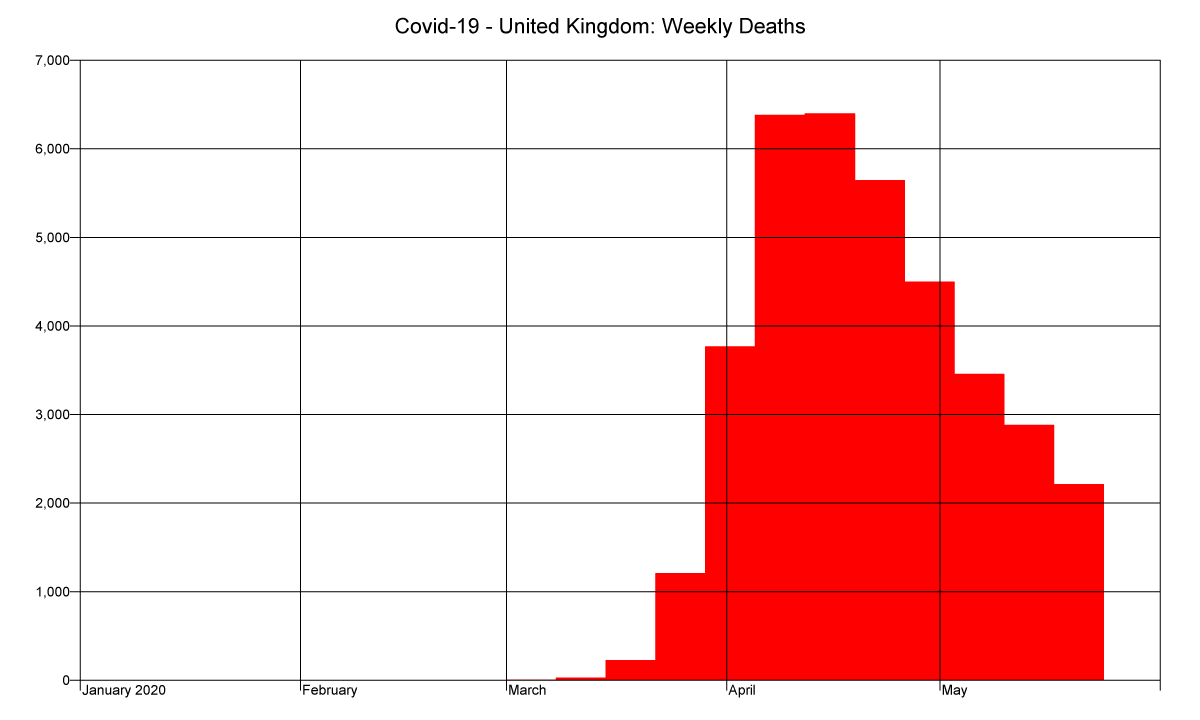
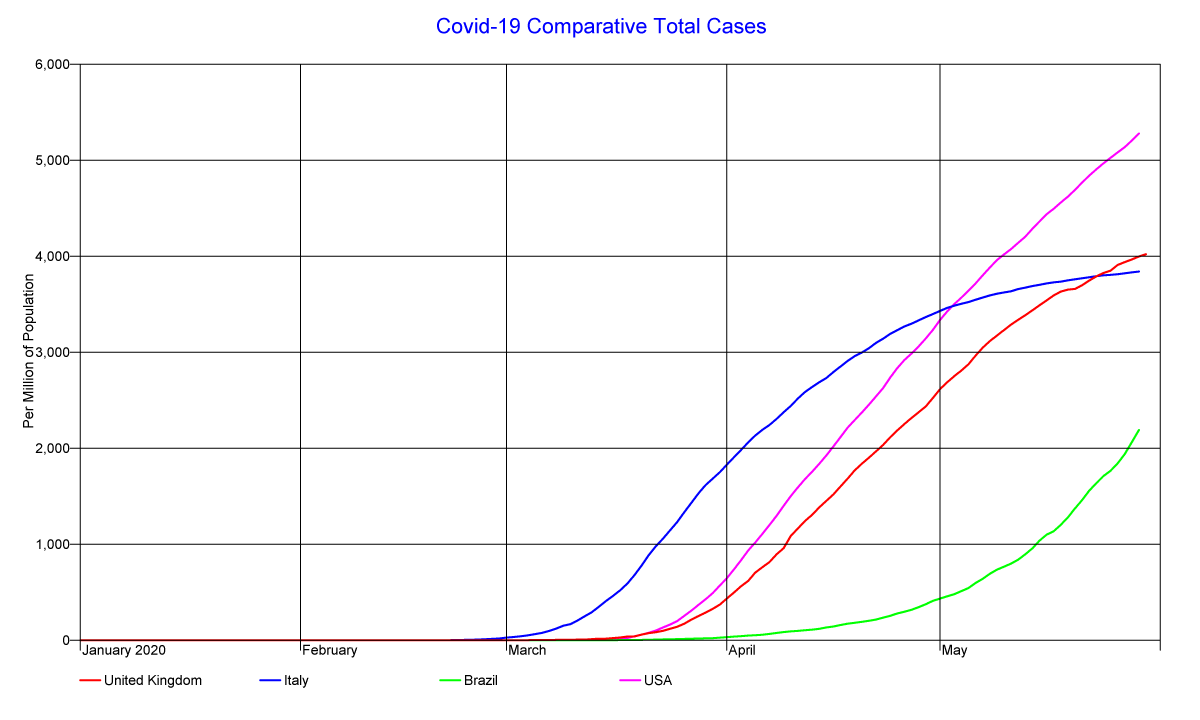
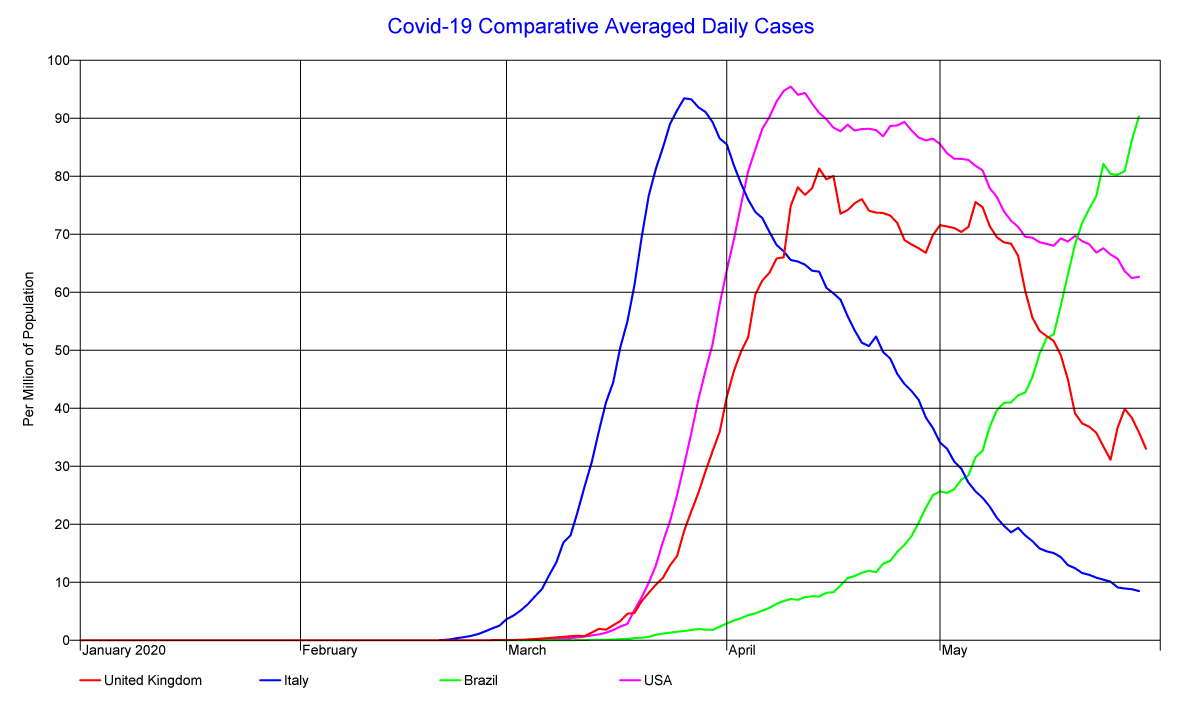
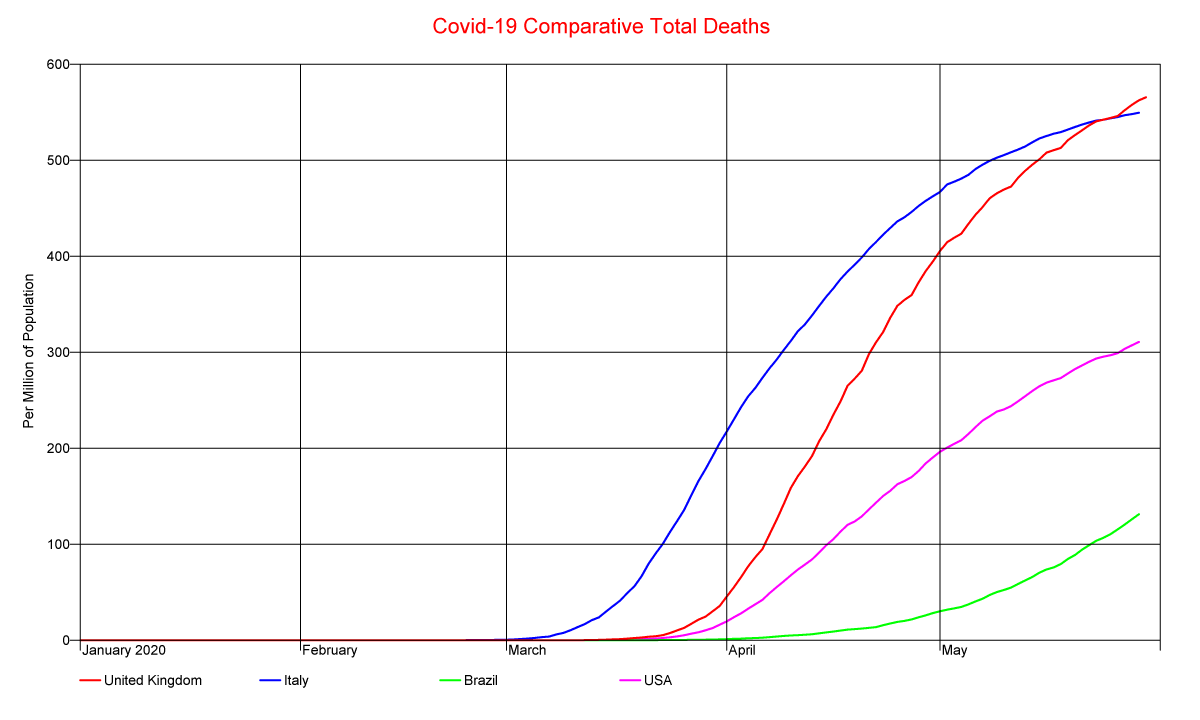
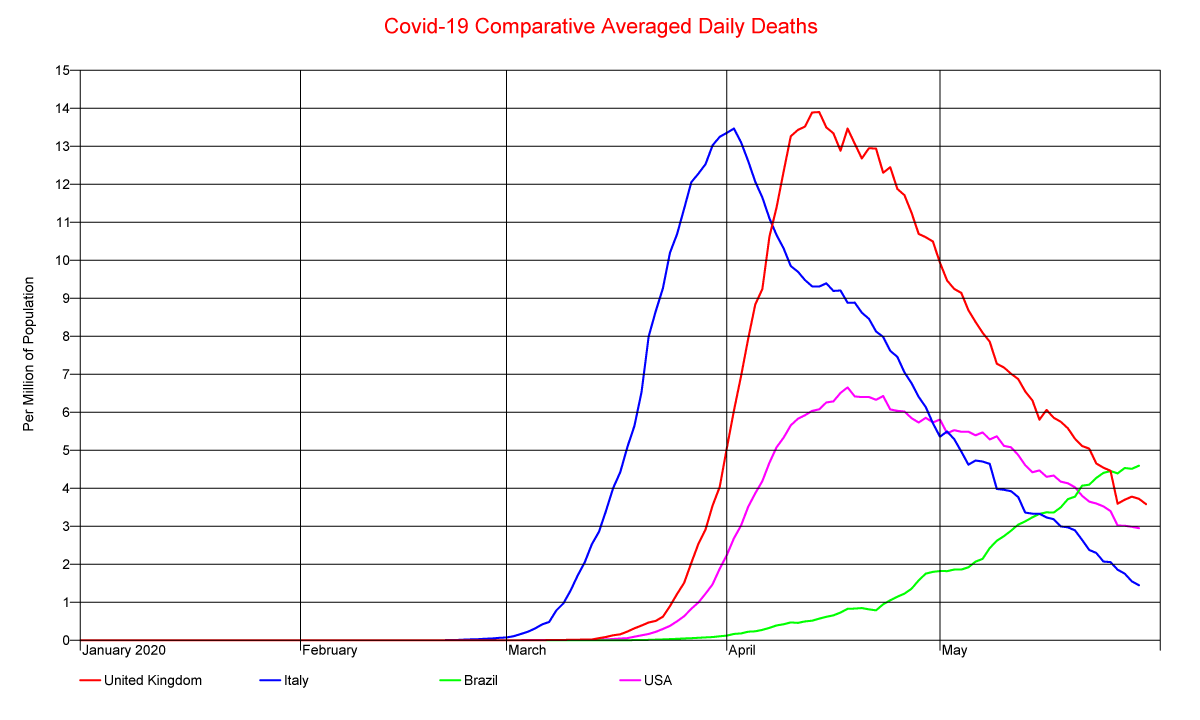
Covid-19
This is a set of plots that I generated for personal use of the progress off the Covid-19 outbreak in
the Unitied Kingdom. It covers both the case rates and death rates and shows totals
as well as averaged rates over the previous seven days ( the daily reports are highly affected
by the weekends - doing a seven day average smooths these ).
Common Source
Common Batch File
Common Data File and Format File
More Plots.
Common Source
Ini File
Miscellaneous
